Results
5.1 Analysis of quantity of waste generation
Quantification (measured using weighing balance) of waste generated per household based on the survey of 1967 households is about 772 kg per day. Table 4 lists the per capita waste generation composition along with descriptive statistics. It reveals that the per capita waste generated is about 91.01 ± 45.5 g/day and organic fraction is 74.09 ± 34.94 g/person/day. Per capita waste generated is positively related with household size and income. Table 5 provides the waste composition, which reveals that organic fraction constitute the major share (81.96%) followed by paper (12.69%)
| &nbps; |
Mean |
Skewness |
Std error |
| Organic |
74.09 ± 34.94 |
0.72 |
0.81 |
| Paper |
19.18 ± 22.22 |
2.88 |
0.65 |
| Metal |
10.66 ± 11.87 |
1.94 |
0.71 |
| Glass |
6.8 ± 5.01 |
0.69 |
0.39 |
| Others |
4.53 ± 1.74 |
5.11 |
0.04 |
Table 4 Waste generation (g/capita/day)
| Composition of waste |
Percentage of waste composition |
| Organic |
81.96 |
| Paper |
12.69 |
| Metal |
1.67 |
| Glass |
0.65 |
| Others |
3.02 |
Table 5 Percentage of composition of waste from surveyed area
Zone wise analysis indicates the variability of waste generated in each zone given in Table 6. The few notable factors which are responsible for the variations are change in the food habits, affluence, income and change in lifestyle. The average organic waste ranges from 66.24 ± 36.77 g/person/day (South East) to 78.84 ± 33.02g/person/day (East) and inorganic waste contributes about 24.71 g/person/day (South, North West) to 31.13 ± 34.19 g/person/day (East). The organic fraction (kitchen) was the largest component which accounts 82% of the total, paper waste is 13% next to kitchen waste. Earlier studies have reported (Chanakya et al., 2005) a relatively lower value, indicating the increase of organic fraction from 72% (in 2005) to about 82%. Higher proportion of organic fraction in MSW and open dumping in absence of appropriate treatment leads to the release of GHG. This necessitates quantification of GHG and appropriate measures to mitigate GHG emissions through the treatment of organic fractions in MSW. Studies done in the neighbouring developing countries, show 66% (Sujauddin et al., 2008) and 90% of Organic waste (Bandara et al., 2007). Figure 3 illustrates the spatial distribution of per capita waste generation per day. It indicates that majority of households, i.e., 926 households generates 50 to 100 g of waste. 497 households generates 100 to 150 g followed by 214 households generates less than 50 g and 155 households generates 150 to 200 g. Table 7 compares city wise the physical composition of household waste, which reveals that MSW in Bangalore has a higher share of organic fractions compared to other cities. The most apt way to treat the waste rich in organic fractions is decentralised systems of either bio-methanation or composting.
| Zones |
Parameters |
Mean |
Minimum |
Maximum |
SD |
Skewness |
Std error |
| East |
Organic
Inorganic |
78.84
31.13 |
4.67
0.63 |
187.50
173.33 |
33.02
34.19 |
0.55
2.25 |
2.03
2.73 |
| NE |
Organic
Inorganic |
78.70
29.98 |
12.50
2.50 |
150.00
125.00 |
31.60
33.35 |
0.27
1.78 |
6.20
8.34 |
| North |
Organic
Inorganic |
71.76
24.82 |
6.67
1.00 |
250.00
186.67 |
35.33
29.07 |
0.87
2.63 |
2.07
2.09 |
| NW |
Organic
Inorganic |
69.14
24.71 |
10.00
0.83 |
200.00
200.00 |
32.51
30.88 |
0.87
2.76 |
2.09
2.40 |
| SE |
Organic
Inorganic |
66.24
29.70 |
12.00
2.00 |
166.67
166.67 |
36.77
39.85 |
0.73
2.28 |
5.61
7.67 |
| South |
Organic
Inorganic |
74.22
24.71 |
12.00
1.25 |
250.00
137.50 |
37.39
26.36 |
0.88
2.01 |
2.20
1.93 |
| SW |
Organic
Inorganic |
74.38
26.56 |
11.11
1.25 |
175.00
187.50 |
34.22
29.85 |
0.48
2.26 |
2.17
2.42 |
| West |
Organic
Inorganic |
75.74
27.37 |
4.17
1.00 |
222.22
208.33 |
35.52
32.66 |
0.70
2.28 |
1.69
1.88 |
Table 6 Statistical analysis of waste generation (g/capita/day) across the zone
| City |
Organic |
Paper |
Plastics |
Metal |
Glass |
Textile |
Wood |
Others |
| Bangalore (India) |
84 |
12 |
- |
1 |
1 |
- |
- |
2 |
| Bejing (China) |
69.3 |
10.3 |
9.8 |
0.8 |
0.6 |
1.3 |
2.7 |
- |
Cape Haitian (Republic of Haitian) |
65.5 |
9.0 |
9.2 |
2.6 |
5.8 |
- |
- |
7.9 |
Chittagong (Bangalesh) 62 3 2 - 5 1 3 - |
62 |
3 |
2 |
- |
5 |
1 |
3 |
- |
Source: Qu et al. (2009), Philippe and Culot (2009) and Sujauddin et al. (2008)
Table 7 Comparison of Household waste generation in different cities (as percentage)
5.2 SWM at household level in greater Bangalore
The collection, transportation and disposal of MSW are significant aspects of waste management. Waste collection [Figure 4(a)] is done either through door-to-door collection systems (64.57%) or through community bins (35.43%). Wards in Bangalore has both community bin and door to door collection system (ex., Bellandru, Varthur, Yelahanka Satellite Town, Vidyaranyapura and Arekere). Households are served with door-to-door collection system [Figure 4(b)] in majority of the wards (Sunkenahalli, Kormangala, Malleshwaram). In Bangalore city, the waste collection is done by the BBMP or outsourced agencies. Swachha Bangalore (or clean Bangalore) a novel initiative was launched in 2003 by the city municipality to manage the waste effectively through door to door collection, segregation at source, etc.

 Figure 4 Waste collection (see online version for colours)
In majority of wards (64%) the waste is collected in the morning (6.00 am to 11.30 am ) and only in 21 households [Figure 5(a)] from surveyed area the waste is collected in the evening mainly in the part of Yelahanka Satellite Town and Herohalli and in 0.36% households [Figure 5(b)], waste is collected in the afternoon.

 Figure 5 Time of waste collection (see online version for colours)
The frequency of collection of waste from door-to-door given in Figure 6a, which highlights of daily waste collection in 46% wards (ex., Sampangiram Nagar at centre of the city, Raja Rajeshwari, Malleshwaram, Rajajinagar, Jayanagar, Bellendur), while weekly four times in 12% wards (ex. Varthur, Hagadur, Kadugodi, Singasandra), thrice a week in 2% wards, twice a week in about 1% wards, once a week in 3% wards. Remaining 1% of the population did not respond to the question [Figure 6(b)].

 Figure 6 Frequency of collection (see online version for colours)
Number of persons involved in door to door collection of waste was also surveyed and is represented in Figures 7(a) and 7(b) respectively. In most of the wards two persons were involved in collecting the waste (39%) followed by one person (20% of the total area). Figure 8(a) illustrates that 35% area have the facility of community bin and 37 households did not respond to the question [Figure 8(b)]. Municipalityis engaged in waste collection from households to final dumping sites in most (90%) parts of the city. In few areas, 8%private contractor and 2% NGO’s (Swabhimana, Swachha Bangalore, Shuchi Mitras) are involved in waste collection.

 Figure 7 Persons involved in door to door collection (see online version for colours)

 Figure 8 Collection of waste (see online version for colours)
The analysis of distance of community bin from the households as represented in Figures 9(a) and 9(b), show that the dustbin is within 100 metre in 23% of the surveyed area, while in 11% area, bins is in the range of 100–500 metre away and ten household did not respond to the question. Remaining houses are served with the door to door collection system. Figure 10(a) and 10(b) reveals that bin size of 1 m
3 accounts 13.5% whereas in 7% area has less than 1 m
3 bin, and majority households (64%) have the facility of door to door collection system of waste. Depending on the local culture, tradition and attitudes towards waste, the bins are allocated and there are two types of storage bins; stationary bin and hauled bin.

 Figure 9 Distance of the bin from house (in metre) (see online version for colours)

 Figure 10 Size of the bin (see online version for colours)
Analyses of the source segregation given in Figures 11(a) and 11(b) respectively, highlight that about 78.34% households do not segregate the waste before dumping into dustbin because of lack of awareness and general attitude of public towards segregation of solid waste, while 21.66% segregate the waste into organic and inorganic waste or dry and wet waste in the south part of Bangalore (ex., Varthur, Dodda Nekundi, HBR layout, Basavanagudi, etc.). Street bin is cleared of litter by the municipality in the locality show that in majority of wards the bin is cleared weekly which accounts 45% while in other wards bin is cleared daily and 2/3 days once were 42% and 13% respectively [Figures 12(a) and 12(b)].

 Figure 11 Segregation of waste (see online version for colours)

 Figure 12 Bin clearance (see online version for colours)
Finally transportation of waste plays an important role in waste management of the city. The transportation of waste and distance of transportation of waste are illustrated in Figures 13(a), 13(b), 14(a) and 14(b) respectively. About 85% of households are not aware about the final destination of transported waste (final dumping site) and only 205 households were aware about the transportation of waste. Among 205 households, 9% stated that the waste is transported between the range of 10–100 km where as 4% stated less than 10 km and 1% stated that waste is transported greater than 100 km and 28 households did not respond to the question. Figures 15(a) and 15(b) reveal that of 71% of the region has no provision of landfill site, while landfill exists only in 28% area mainly in the north-east and west part of the outskirts in the Bangalore.

 Figure 13 Transportation of waste (see online version for colours)

 Figure 14 Distance of the waste transportation (see online version for colours)

 Figure 15 Landfill site in the region (see online version for colours)
5.3 Survey of socio-economic factors
A number of socio-economic parameters such as household size, income, employment status and education status influence the quantum of solid waste generated. Table 8 shows the frequency, percentage and cumulative percentage of the socio-economic factors of households. It indicates the average household size is 4.5 ± 1.74 persons/hh. Majority of the households have four (45.86%) persons, followed by five persons (19.2%), three persons (15%), six persons (13.9%), greater than six (5.4%), etc. The education and employment status mainly influence the food habits, materials consumed and waste generation. Graduates constitute 36.71% followed by high school educated (24.66%). The average monthly income INR 35,563.63 ± 77,851, which is similar to earlier studies (Sankoh et al., 2012; Getahun et al., 2012; Dennison et al., 1996).
| Variables name |
Frequency |
% |
Cumulative % |
| 1 Family size |
| 2 |
20 |
1.02 |
1.02 |
| 3 |
286 |
14.54 |
15.56 |
| 4 |
902 |
45.86 |
61.41 |
| 5 |
378 |
19.22 |
80.63 |
| 6 |
146 |
7.42 |
88.05 |
| More than 6 |
128 |
6.51 |
94.56 |
| No response |
107 |
5.44 |
100.00 |
| 2 Education status |
| Middle school or lower |
134 |
6.81 |
6.81 |
| High school |
485 |
24.66 |
31.47 |
| Technical school |
278 |
14.13 |
45.60 |
| Universities |
722 |
36.71 |
82.31 |
| Masters 269 13.68 95.98 |
269 |
13.68 |
95.98 |
| PhD |
79 |
4.02 |
100.00 |
| 3 Employment status |
| Government institution |
460 |
23.39 |
23.39 |
| School/hospital/research or design institute |
83 |
4.22 |
27.61 |
| Foreign corporation |
113 |
5.74 |
33.35 |
| Local company |
235 |
11.95 |
45.30 |
| State corporation |
67 |
3.41 |
48.70 |
| Business institute |
391 |
19.88 |
68.58 |
| Others 587 29.84 98.42 |
587 |
29.84 |
98.42 |
| No response |
31 |
1.58 |
100.00 |
| 4 Monthly income |
| < 10,000 |
509 |
25.88 |
25.88 |
| 0000–50,000 |
1192 |
60.60 |
86.48 |
| 50,000–100,000 |
183 |
9.30 |
95.78 |
| >100,000 |
83 |
4.22 |
100.00 |
Table 8 Frequency, percentage and cumulative percentage of the socio-economic factors
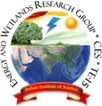
5.4 Relationship between the quantity of HSW generated and socio-economic factors
Family size is an important factor in the household waste generation and Figure 16(a) reveals that the household size was positively related to the daily per capita waste generation. As the family size increases, the total waste generation of household increases and per capita waste generation decrease gradually similar to the earlier reports (Jones et al. 2009; Hockett and Lober, 1995) indicating smaller household size produced more per capita waste than the larger household size. Figure 16b indicate that family with an income>100,000 produces more per capita waste compared to the other families. The relationship between family income and per capita waste quantity was found to be significant, i.e., as the family income increases the consumption pattern and purchase trend increases which in turn leads generation of more solid waste quantity, comparable to the earlier reports (Sujauddin et al., 2008; Dennison et al., 1996) highlighting that family income is positively related to the waste generation rate. The education levels of the family were not found to be significantly [Figure 16(c)] related with per capita waste generation. Families with the education level of masters produces more per capita waste compared to the families with higher levels of education (persons with PhD). In this study the employment status is not significantly relatedto the waste generation [Figure 16(d)]. The head of the family who are in the business produces more waste than the families who are working in the other sectors. The total waste generation from the household increases as the income increases is depicted in Figure 16(e). Table 9 lists the descriptive statistics on the physical composition of household waste with different socioeconomic groups. This indicates that organic waste is the prominent component in the solid waste composition in all the socio-economic groups. It is also evident that as the income level increases the organic waste composition decreases with the increase in the proportion of paper, metal, glass and others. The organic waste generated from household varies from 80–82% in the surveyed area. Among them, the high income family group (annual income> 1,000,000 INR) produces the lowest (80.31%) organic waste and low income family group (<100,000 INR) produces the highest organic waste (85.52%). The organic waste generation was found to be increasing from high income family group to low income family group. The opposite trend is observed for the paper, glass and others.
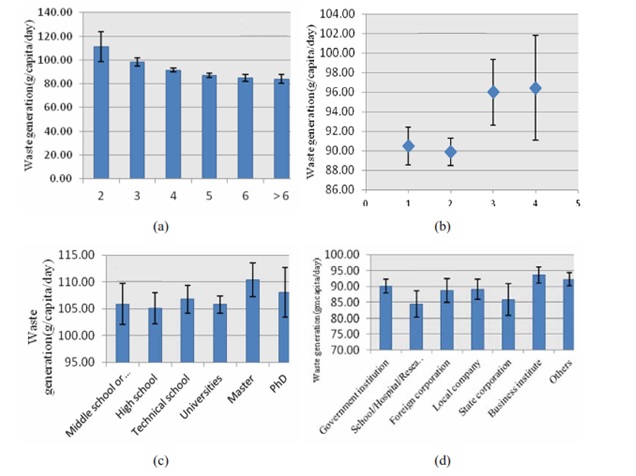
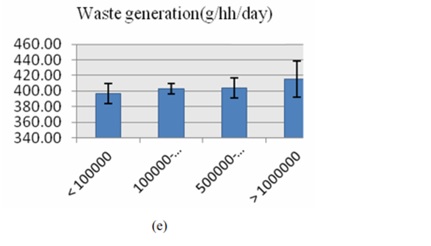
Figure 16 Relationship of per capita waste generation with socio-economic factors, (a) household size (b) 100,000, 4: >100,000 (c) educational level (d) occupation (e) annual income (see online version for colours)
| Annual income |
Organic |
Paper |
Metal |
Glass |
Others |
| < 100,000 |
85.52 |
11.62 |
1.20 |
0.52 |
1.14 |
| 100,000–500,000 |
84.09 |
11.35 |
1.51 |
0.58 |
2.47 |
| 500,000–1,000,000 |
82.99 |
13.50 |
1.22 |
0.58 |
1.72 |
| > 1,000,000 |
80.31 |
14.72 |
1.73 |
0.63 |
2.61 |
Table 9 Descriptive statistics of physical composition of household waste generated with different socio-economic groups (as a percentage)
5.5 Carbon dioxide emissions from household waste
Mismanaged municipal solid waste is the significant contributor to the greenhouse gases such as methane and carbon dioxide in the atmosphere. CO2equivalent emission from organic waste generated at household is calculated by using the equation (3). According to this study, the total organic waste generated from surveyed houses was 231.01 tons/year and total emission is about 604.80 tons/year. Table 10 lists zone wise CO2equivalent emission (Gg/year) from solid waste generated in Bangalore. The Mean ward wise CO2emission varies from 2.59 (North) to 3.23 Gg/year (South West). The CO2equivalent emission from solid waste generated at household (kg/capita/day) is depicted in Table 11. It reveals that the average CO2equivalent emission is low in South East (0.17 kg/capita/day) and highest in East and North East zones (0.21 kg/capita/day). Figure 17 reveals the per capita CO2equivalent emission from households in the surveyed area. 926 households emits 50–100 kg/person/year, 624 households emits less than 50 kg/person/year, 247 households emits 100–150 kg/person/year and only 46 households emits more than 150 kg/person /year. Quantification of GHG emissions from all the wards of Bangalore, reveal that the average ward-wise CO2 equivalent emission is 2.93 ± 0.91 Gg/year. 47 wards emits in the range of 3 to 3.5Gg/year while 46 wards emits more than 3.5 Gg/year. Forty-five wards emit in the range of 2 to 2.5 Gg/year, 39 wards 2.5 to 3 Gg/year and 18 wards emits in the range of 1.5 to 2 Gg/year. Remaining seven wards emits less than 1.5 Gg/year.
| Zone |
Mean |
Min |
Max |
Sum |
SD |
| East |
3.11 |
0.49 |
5.37 |
62.21 |
1.21 |
| North East |
2.89 |
1.66 |
4.70 |
57.87 |
0.80 |
| North |
2.59 |
0.60 |
5.58 |
54.41 |
1.01 |
| North West |
3.05 |
1.99 |
3.75 |
70.15 |
0.50 |
| South East |
2.72 |
0.59 |
6.25 |
32.62 |
1.47 |
| South |
2.62 |
1.01 |
4.69 |
83.93 |
0.80 |
| South West |
3.23 |
2.00 |
6.25 |
96.90 |
0.82 |
| West |
3.10 |
1.76 |
4.84 |
102.18 |
0.78 |
Table 10 CO2equivalent emission from solid waste in Bangalore (Gg/year) across the zone
| Zone |
Mean |
Sum |
Minimum |
Maximum |
SD |
| East |
0.21 |
54.49 |
0.01 |
0.49 |
0.09 |
| North East |
0.21 |
5.36 |
0.03 |
0.39 |
0.08 |
| North |
0.19 |
54.67 |
0.02 |
0.65 |
0.09 |
| North West |
0.18 |
43.81 |
0.03 |
0.52 |
0.09 |
| South East |
0.17 |
7.46 |
0.03 |
0.44 |
0.10 |
| South |
0.19 |
56.15 |
0.03 |
0.65 |
0.10 |
| South West |
0.19 |
48.30 |
0.03 |
0.46 |
0.09 |
| West |
0.20 |
87.25 |
0.01 |
0.58 |
0.09 |
Table 11 CO2equivalent emission from solid waste generated at household (kg/capita/day) across zone
Figure 17 Per capita CO2equivalent emission from HSW generated (see online version for colours)
5.6 Mitigation of GHG emissions
Scope for mitigation of GHG emission is through the recovery and conversion of organic component (which constitute 82%) to energy or compost. Policy interventions for the adoption of integrated solid waste management (ISWM) through the incorporation of the waste management hierarchy considering direct impacts (transportation, collection, treatment and disposal of waste) and indirect impacts (use of waste materials and energy outside the waste management system) would reduce the carbon footprint due to mismanagement of waste (Ramachandra, 2011). ISWM framework optimises the existing systems and implements new waste management systems. In addition to climate concern, the recycling and energy recovery enriches the resource efficiency and reduce the environmental impacts from GHG emission. The strategy includes:
• Door to door collection of waste with incentive based mechanism to enhance segregation at source: This entails
- Deploying appropriate mobile collection vans (for each locality) with an option to store segregated and unsegregated wastes
- Incentive of Rs 1 per kg of segregated organic waste and payment directly to the respective household account through direct bank transfer
- Disincentive to unsegregated waste individuals who refuse to segregate needs to pay Rs 5 per kg of unsegregated waste. Revenue generation would encourage many households to switch over to segregation.
• Segregation of waste at source. The biodegradable organic waste bring a dominant component in MSW, treatment of organic fractions through appropriate technologies helps in the resource recovery while addressing its negative impact on the environment and potential economic benefits.
• A waste stream with a high biodegradable organic content can be processed to produce high-quality compost which avoids land filling and enables the provision of manure to enrich nutrients in the soil. The biodegradable fraction has the appropriate moisture content for composting.
• Promotion of recycling or reuse of segregated material reduces the quantity of waste and the burden on landfills, and provides raw materials for manufacturers.
• Improved storage containers for the storage of biodegradable / wet wastes.
• Setting up transfer stations taking in to account local situations to improve the efficiency of waste collection, especially in narrow roads and slums,. This will ensure the proper handling of wastes and the reduction of transportation costs.
• Primary collection of waste stored in various locations on a daily basis through active public participation
• Improved collection vehicle design to increase capacity and ergonomic efficiency.
• A helpline to tackle various issues such as road sweeping, open dump, open burning, garbage collection, etc.
• Garbage tax to be levied to the large and small generators for the disposal of wastes.
• Adequate training to all the levels of staff engaged in SWM to handle respective functional aspects (collection, generation, storage, segregation of waste, etc.).
• Adoption of technological solutions such as bio-gas recovery, composting, etc. for affecting improved recovery and disposal of waste.
• Collection trucks to have global positioning system (GPS) which would help in online tracking and also in reducing malpractices associated with waste management.
• Transparency in the administration though online availability of spatial information system, accessible to all including public. Adoption of geographic information system (GIS) with GPS would streamline collection of waste garbage and improves efficiency.
• Constitution of citizen forum in each corporation ward involving local people, NGO’s and concerned authorities to ensure close monitoring and supervision of waste management practices regularly.
• Taking into account the bulk wastes to be handled every day, sanitary landfill sites have to be set up to dispose of the rejects after composting and landfilling.
• Regular monitoring of sanitary landfill sites involving local people in the team along with sanitary authorities.
• Administrative restructuring of the urban local bodies to discharge more efficiently specific responsibilities. This requires structural changes within the administration aimed at decentralising authority and responsibilities. This also includes periodic meetings among the staff and between the executives and elected wing of the corporation.
• Encouraging the involvement of local NGO’s in working on various environmental awareness programmes and areas related to waste management including educating the public about the importance and necessity of better waste management.